起步
安装echarts依赖
由于前端基础框架中已经安装了 echarts ,直接引用即可。
npm install echarts -s
安装完 echarts 依赖之后可在 main.js 里面直接全局引用或者在需要使用到图表的模块单独引用。
// 在单独模块中引用
import echarts from 'echarts'

// 在 main.js 中全局引用
import echarts from 'echarts'
柱状图

<div id="histogram" style="width: 100%;height: 300px;display: inline-block;"></div>
import echarts from 'echarts' // 此处引入echarts

export default {
  data() {
    return {
      histogram: {
        dataX: ['星期一', '星期二', '星期三', '星期四', '星期五', '星期六', '星期日'],
        dataY: [10, 52, 200, 334, 390, 330, 220]
      }
    }
  },
  mounted() {
    this.histogramChartInit()
  },
  methods: {
    histogramChartInit() { // 柱状图初始化
      const _this = this
      let myChart = echarts.init(document.getElementById('histogram'))
      const option = {
        color: ['#3398DB'],
        tooltip: {
          trigger: 'axis',
          axisPointer: { // 坐标轴指示器,坐标轴触发有效
            type: 'shadow' // 默认为直线,可选为:'line' | 'shadow'
          }
        },
        grid: {
          left: '3%',
          right: '4%',
          bottom: '3%',
          containLabel: true
        },
        xAxis: [
          {
            type: 'category',
            data: _this.histogram.dataX,
            axisTick: {
              alignWithLabel: true
            }
          }
        ],
        yAxis: [
          {
            type: 'value'
          }
        ],
        series: [
          {
            name: '访问人数',
            type: 'bar',
            barWidth: '60%',
            data: _this.histogram.dataY
          }
        ]
      }
      myChart.setOption(option)
    }
  }
}
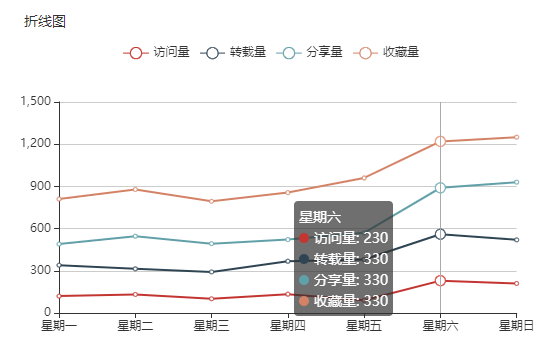
折线图
<div id="lineChart" style="width: 100%;height: 300px;display: inline-block;"></div>
import echarts from 'echarts' // 此处引入echarts

export default {
  data() {
    return {
      lineChart: {
          lineChartHead: ['访问量', '转载量', '分享量', '收藏量'],
          dataX: ['星期一', '星期二', '星期三', '星期四', '星期五', '星期六', '星期日'],
          dataY: {
            trafficVolume: [120, 132, 101, 134, 90, 230, 210],
            reloadVolume: [220, 182, 191, 234, 290, 330, 310],
            sharingQuantity: [150, 232, 201, 154, 190, 330, 410],
            collectionVolume: [320, 332, 301, 334, 390, 330, 320]
          }
        }
    }
  },
  mounted() {
    this.lineChartInit()
  },
  methods: {
    lineChartInit() { // 折线图初始化
      const _this = this
      let myChart = echarts.init(document.getElementById('lineChart'))
      const option = {
        tooltip: {
          trigger: 'axis'
        },
        legend: {
          data: _this.lineChart.lineChartHead
        },
        grid: {
          left: '3%',
          right: '4%',
          bottom: '3%',
          containLabel: true
        },
        xAxis: {
          type: 'category',
          boundaryGap: false,
          data: _this.lineChart.dataX
        },
        yAxis: {
          type: 'value'
        },
        series: [
          {
            name: '访问量',
            type: 'line',
            stack: '总量',
            data: _this.lineChart.dataY.trafficVolume
          },
          {
            name: '转载量',
            type: 'line',
            stack: '总量',
            data: _this.lineChart.dataY.reloadVolume
          },
          {
            name: '分享量',
            type: 'line',
            stack: '总量',
            data: _this.lineChart.dataY.sharingQuantity
          },
          {
            name: '收藏量',
            type: 'line',
            stack: '总量',
            data: _this.lineChart.dataY.collectionVolume
          }
        ]
      }
      myChart.setOption(option)
    },
  }
}
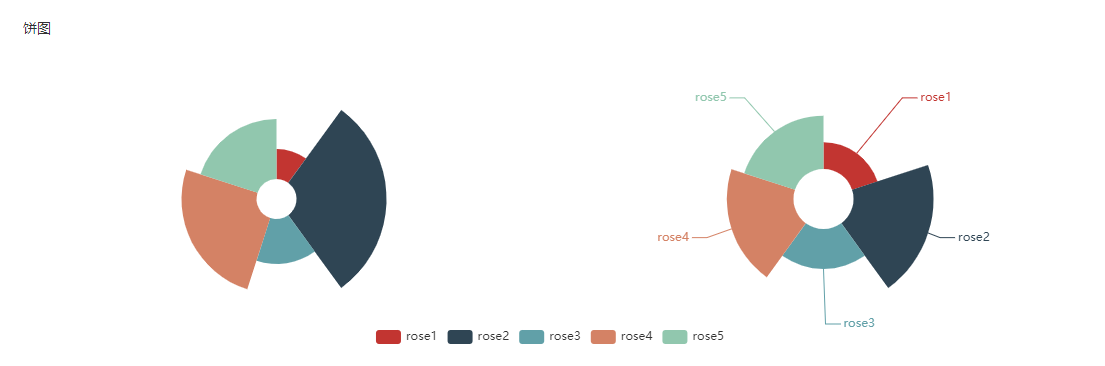
饼图
<div id="pieChart" style="width: 100%;height: 300px;display: inline-block;"></div>
import echarts from 'echarts' // 此处引入echarts

export default {
  data() {
    return {
      pieChart: {
          legendData: ['rose1', 'rose2', 'rose3', 'rose4', 'rose5'],
          radiusData: [
            { value: 10, name: 'rose1' },
            { value: 30, name: 'rose2' },
            { value: 15, name: 'rose3' },
            { value: 25, name: 'rose4' },
            { value: 20, name: 'rose5' }
          ],
          areaData: [
            { value: 10, name: 'rose1' },
            { value: 30, name: 'rose2' },
            { value: 15, name: 'rose3' },
            { value: 25, name: 'rose4' },
            { value: 20, name: 'rose5' }
          ]
      }
    }
  },
  mounted() {
    this.pieChartInit()
  },
  methods: {
    pieChartInit() { // 饼状图初始化
      const _this = this
      let myChart = echarts.init(document.getElementById('pieChart'))
      const option = {
        tooltip: {
          trigger: 'item',
          formatter: '{a} <br/>{b} : {c} ({d}%)'
        },
        legend: {
          x: 'center',
          y: 'bottom',
          data: _this.pieChart.legendData
        },
        calculable: true,
        series: [
          {
            name: '半径模式',
            type: 'pie',
            radius: [20, 110],
            center: ['25%', '50%'],
            roseType: 'radius',
            label: {
              normal: {
                show: false
              },
              emphasis: {
                show: true
              }
            },
            lableLine: {
              normal: {
                show: false
              },
              emphasis: {
                show: true
              }
            },
            data: _this.pieChart.radiusData
          },
          {
            name: '面积模式',
            type: 'pie',
            radius: [30, 110],
            center: ['75%', '50%'],
            roseType: 'area',
            data: _this.pieChart.areaData
          }
        ]
      }
      myChart.setOption(option)
    }
  }
}
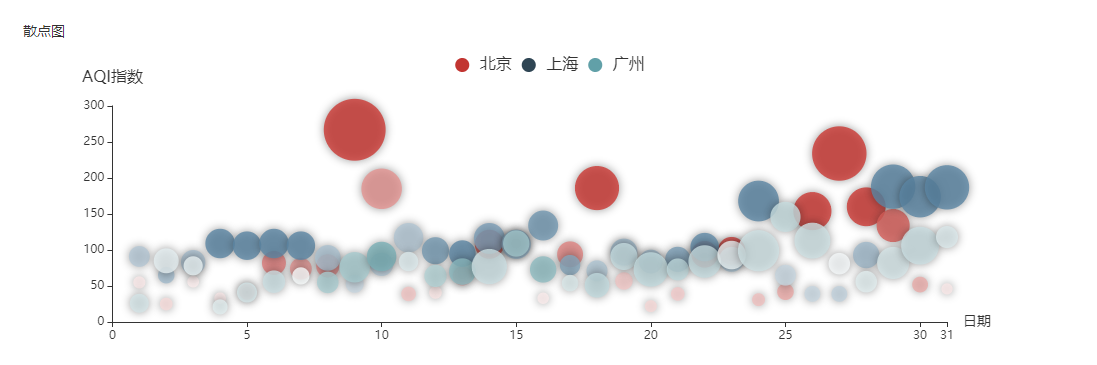
散点图
<div id="scatterChart" style="width: 100%;height: 300px;display: inline-block;"></div>
import echarts from 'echarts' // 此处引入echarts

export default {
  data() {
    return {
      scatterChart: {
          dataBj: [
            [1, 55, 9, 56, 0.46, 18, 6, '良'],
            [2, 25, 11, 21, 0.65, 34, 9, '优'],
            [3, 56, 7, 63, 0.3, 14, 5, '良'],
            [4, 33, 7, 29, 0.33, 16, 6, '优'],
            [5, 42, 24, 44, 0.76, 40, 16, '优'],
            [6, 82, 58, 90, 1.77, 68, 33, '良'],
            [7, 74, 49, 77, 1.46, 48, 27, '良'],
            [8, 78, 55, 80, 1.29, 59, 29, '良'],
            [9, 267, 216, 280, 4.8, 108, 64, '重度污染'],
            [10, 185, 127, 216, 2.52, 61, 27, '中度污染'],
            [11, 39, 19, 38, 0.57, 31, 15, '优'],
            [12, 41, 11, 40, 0.43, 21, 7, '优'],
            [13, 64, 38, 74, 1.04, 46, 22, '良'],
            [14, 108, 79, 120, 1.7, 75, 41, '轻度污染'],
            [15, 108, 63, 116, 1.48, 44, 26, '轻度污染'],
            [16, 33, 6, 29, 0.34, 13, 5, '优'],
            [17, 94, 66, 110, 1.54, 62, 31, '良'],
            [18, 186, 142, 192, 3.88, 93, 79, '中度污染'],
            [19, 57, 31, 54, 0.96, 32, 14, '良'],
            [20, 22, 8, 17, 0.48, 23, 10, '优'],
            [21, 39, 15, 36, 0.61, 29, 13, '优'],
            [22, 94, 69, 114, 2.08, 73, 39, '良'],
            [23, 99, 73, 110, 2.43, 76, 48, '良'],
            [24, 31, 12, 30, 0.5, 32, 16, '优'],
            [25, 42, 27, 43, 1, 53, 22, '优'],
            [26, 154, 117, 157, 3.05, 92, 58, '中度污染'],
            [27, 234, 185, 230, 4.09, 123, 69, '重度污染'],
            [28, 160, 120, 186, 2.77, 91, 50, '中度污染'],
            [29, 134, 96, 165, 2.76, 83, 41, '轻度污染'],
            [30, 52, 24, 60, 1.03, 50, 21, '良'],
            [31, 46, 5, 49, 0.28, 10, 6, '优']
          ],
          dataGz: [
            [1, 26, 37, 27, 1.163, 27, 13, '优'],
            [2, 85, 62, 71, 1.195, 60, 8, '良'],
            [3, 78, 38, 74, 1.363, 37, 7, '良'],
            [4, 21, 21, 36, 0.634, 40, 9, '优'],
            [5, 41, 42, 46, 0.915, 81, 13, '优'],
            [6, 56, 52, 69, 1.067, 92, 16, '良'],
            [7, 64, 30, 28, 0.924, 51, 2, '良'],
            [8, 55, 48, 74, 1.236, 75, 26, '良'],
            [9, 76, 85, 113, 1.237, 114, 27, '良'],
            [10, 91, 81, 104, 1.041, 56, 40, '良'],
            [11, 84, 39, 60, 0.964, 25, 11, '良'],
            [12, 64, 51, 101, 0.862, 58, 23, '良'],
            [13, 70, 69, 120, 1.198, 65, 36, '良'],
            [14, 77, 105, 178, 2.549, 64, 16, '良'],
            [15, 109, 68, 87, 0.996, 74, 29, '轻度污染'],
            [16, 73, 68, 97, 0.905, 51, 34, '良'],
            [17, 54, 27, 47, 0.592, 53, 12, '良'],
            [18, 51, 61, 97, 0.811, 65, 19, '良'],
            [19, 91, 71, 121, 1.374, 43, 18, '良'],
            [20, 73, 102, 182, 2.787, 44, 19, '良'],
            [21, 73, 50, 76, 0.717, 31, 20, '良'],
            [22, 84, 94, 140, 2.238, 68, 18, '良'],
            [23, 93, 77, 104, 1.165, 53, 7, '良'],
            [24, 99, 130, 227, 3.97, 55, 15, '良'],
            [25, 146, 84, 139, 1.094, 40, 17, '轻度污染'],
            [26, 113, 108, 137, 1.481, 48, 15, '轻度污染'],
            [27, 81, 48, 62, 1.619, 26, 3, '良'],
            [28, 56, 48, 68, 1.336, 37, 9, '良'],
            [29, 82, 92, 174, 3.29, 0, 13, '良'],
            [30, 106, 116, 188, 3.628, 101, 16, '轻度污染'],
            [31, 118, 50, 0, 1.383, 76, 11, '轻度污染']
          ],
          dataSh: [
            [1, 91, 45, 125, 0.82, 34, 23, '良'],
            [2, 65, 27, 78, 0.86, 45, 29, '良'],
            [3, 83, 60, 84, 1.09, 73, 27, '良'],
            [4, 109, 81, 121, 1.28, 68, 51, '轻度污染'],
            [5, 106, 77, 114, 1.07, 55, 51, '轻度污染'],
            [6, 109, 81, 121, 1.28, 68, 51, '轻度污染'],
            [7, 106, 77, 114, 1.07, 55, 51, '轻度污染'],
            [8, 89, 65, 78, 0.86, 51, 26, '良'],
            [9, 53, 33, 47, 0.64, 50, 17, '良'],
            [10, 80, 55, 80, 1.01, 75, 24, '良'],
            [11, 117, 81, 124, 1.03, 45, 24, '轻度污染'],
            [12, 99, 71, 142, 1.1, 62, 42, '良'],
            [13, 95, 69, 130, 1.28, 74, 50, '良'],
            [14, 116, 87, 131, 1.47, 84, 40, '轻度污染'],
            [15, 108, 80, 121, 1.3, 85, 37, '轻度污染'],
            [16, 134, 83, 167, 1.16, 57, 43, '轻度污染'],
            [17, 79, 43, 107, 1.05, 59, 37, '良'],
            [18, 71, 46, 89, 0.86, 64, 25, '良'],
            [19, 97, 71, 113, 1.17, 88, 31, '良'],
            [20, 84, 57, 91, 0.85, 55, 31, '良'],
            [21, 87, 63, 101, 0.9, 56, 41, '良'],
            [22, 104, 77, 119, 1.09, 73, 48, '轻度污染'],
            [23, 87, 62, 100, 1, 72, 28, '良'],
            [24, 168, 128, 172, 1.49, 97, 56, '中度污染'],
            [25, 65, 45, 51, 0.74, 39, 17, '良'],
            [26, 39, 24, 38, 0.61, 47, 17, '优'],
            [27, 39, 24, 39, 0.59, 50, 19, '优'],
            [28, 93, 68, 96, 1.05, 79, 29, '良'],
            [29, 188, 143, 197, 1.66, 99, 51, '中度污染'],
            [30, 174, 131, 174, 1.55, 108, 50, '中度污染'],
            [31, 187, 143, 201, 1.39, 89, 53, '中度污染']
          ],
          schema: [
            { name: 'date', index: 0, text: '日' },
            { name: 'AQIindex', index: 1, text: 'AQI指数' },
            { name: 'PM25', index: 2, text: 'PM2.5' },
            { name: 'PM10', index: 3, text: 'PM10' },
            { name: 'CO', index: 4, text: '一氧化碳(CO)' },
            { name: 'NO2', index: 5, text: '二氧化氮(NO2)' },
            { name: 'SO2', index: 6, text: '二氧化硫(SO2)' }
          ],
          itemStyle: {
            normal: {
              opacity: 0.8,
              shadowBlur: 10,
              shadowOffsetX: 0,
              shadowOffsetY: 0,
              shadowColor: 'rgba(0, 0, 0, 0.5)'
            }
          }
      }
    }
  },
  mounted() {
    this.scatterInit()
  },
  methods: {
    scatterInit() { // 散点图初始化
      const _this = this
      let myChart = echarts.init(document.getElementById('scatterChart'))
      const option = {
        legend: {
          y: 'top',
          data: ['北京', '上海', '广州'],
          textStyle: {
            color: '#333',
            fontSize: 16
          }
        },
        grid: {
          x: '10%',
          x2: 150,
          y: '18%',
          y2: '10%'
        },
        tooltip: {
          padding: 10,
          backgroundColor: '#222',
          borderColor: '#777',
          borderWidth: 1,
          formatter: function(obj) {
            var value = obj.value
            return '<div style="border-bottom: 1px solid rgba(255,255,255,.3); font-size: 18px;padding-bottom: 7px;margin-bottom: 7px">' +
              obj.seriesName + ' ' + value[0] + '日:' +
              value[7] +
              '</div>'
              // _this.scatterChart.schema[1].text + ':' + value[1] + '<br>' +
              // _this.scatterChart.schema[2].text + ':' + value[2] + '<br>' +
              // _this.scatterChart.schema[3].text + ':' + value[3] + '<br>' +
              // _this.scatterChart.schema[4].text + ':' + value[4] + '<br>' +
              // _this.scatterChart.schema[5].text + ':' + value[5] + '<br>' +
              // _this.scatterChart.schema[6].text + ':' + value[6] + '<br>'
          }
        },
        xAxis: {
          type: 'value',
          name: '日期',
          nameGap: 16,
          nameTextStyle: {
            color: '#333',
            fontSize: 14
          },
          max: 31,
          splitLine: {
            show: false
          },
          axisLine: {
            lineStyle: {
              color: '#333'
            }
          }
        },
        yAxis: {
          type: 'value',
          name: 'AQI指数',
          nameLocation: 'end',
          nameGap: 20,
          nameTextStyle: {
            color: '#333',
            fontSize: 16
          },
          axisLine: {
            lineStyle: {
              color: '#333'
            }
          },
          splitLine: {
            show: false
          }
        },
        visualMap: [
          {
            show: false,
            left: 'right',
            top: '10%',
            dimension: 2,
            min: 0,
            max: 250,
            itemWidth: 30,
            itemHeight: 120,
            calculable: true,
            precision: 0.1,
            text: ['圆形大小:PM2.5'],
            textGap: 30,
            textStyle: {
              color: '#fff'
            },
            inRange: {
              symbolSize: [10, 70]
            },
            outOfRange: {
              symbolSize: [10, 70],
              color: ['rgba(255,255,255,.2)']
            },
            controller: {
              inRange: {
                color: ['#c23531']
              },
              outOfRange: {
                color: ['#444']
              }
            }
          },
          {
            show: false,
            left: 'right',
            bottom: '5%',
            dimension: 6,
            min: 0,
            max: 50,
            itemHeight: 120,
            calculable: true,
            precision: 0.1,
            text: ['明暗:二氧化硫'],
            textGap: 30,
            textStyle: {
              color: '#fff'
            },
            inRange: {
              colorLightness: [1, 0.5]
            },
            outOfRange: {
              color: ['rgba(255,255,255,.2)']
            },
            controller: {
              inRange: {
                color: ['#c23531']
              },
              outOfRange: {
                color: ['#444']
              }
            }
          }
        ],
        series: [
          {
            show: false,
            name: '北京',
            type: 'scatter',
            itemStyle: _this.scatterChart.itemStyle,
            data: _this.scatterChart.dataBj
          },
          {
            name: '上海',
            type: 'scatter',
            itemStyle: _this.scatterChart.itemStyle,
            data: _this.scatterChart.dataSh
          },
          {
            name: '广州',
            type: 'scatter',
            itemStyle: _this.scatterChart.itemStyle,
            data: _this.scatterChart.dataGz
          }
        ]
      }
      myChart.setOption(option)
    }
  }
}
散点图
<div id="cricularGraph" style="width: 100%;height: 300px;display: inline-block;"></div>
import echarts from 'echarts' // 此处引入echarts

export default {
  data() {
    return {
      cricularGraph: {
          legendData: ['直接访问', '邮件营销', '联盟广告', '视频广告', '搜索引擎'],
          seriesData: [
            { value: 335, name: '直接访问' },
            { value: 310, name: '邮件营销' },
            { value: 234, name: '联盟广告' },
            { value: 135, name: '视频广告' },
            { value: 1548, name: '搜索引擎' }
          ]
      }
    }
  },
  mounted() {
    this.cricularGraphInit()
  },
  methods: {
    cricularGraphInit() { // 环形图初始化
      const _this = this
      let myChart = echarts.init(document.getElementById('cricularGraph'))
      const option = {
        tooltip: {
          trigger: 'item',
          formatter: '{a} <br/>{b}: {c} ({d}%)'
        },
        legend: {
          orient: 'vertical',
          x: 'left',
          data: _this.cricularGraph.legendData
        },
        series: [
          {
            name: '访问来源',
            type: 'pie',
            radius: ['50%', '70%'],
            avoidLabelOverlap: false,
            label: {
              normal: {
                show: false,
                position: 'center'
              },
              emphasis: {
                show: true,
                textStyle: {
                  fontSize: '30',
                  fontWeight: 'bold'
                }
              }
            },
            labelLine: {
              normal: {
                show: false
              }
            },
            data: _this.cricularGraph.seriesData
          }
        ]
      }
      myChart.setOption(option)
    }
  }
}